Tech info on MP - Dyno
Find your vehicle...
Tuning Technical Information
We are increasingly getting inquiries from customers having problems with standard vehicles. They are being frustrated with New Car Dealers who are not listening to their complaints about their vehicles poor Economy or Performance. Dealers are finding themselves caught in the middle as manufacturers dumb down the test procedures which the dealers are only allowed to carry out. They are only permitted to replace what their Diagnostic Equipment determines, so faulty sensors sending incorrectly calibrated signals, result in the Diagnostic Equipment not seeing the real faults. These Pages are here to give you a better understanding of how your vehicle works & help you diagnose problems you are having with your vehicle.
Why does the Dyno graph show all the power gain at only high RPM?
Why does this power gain need to be at such a high rpm on a Diesel? We prefer to see the biggest power gain over standard to be at the low & mid range rpm band. To achieve this, the fuel delivery either by Injector duty cycle or Fuel Rail Sensor never needs to even come close to the Maximum Standard Fuel Pressure which the High Pressure Pump is already designed to produce at full throttle. It simply needs slightly more fuel, earlier at lighter accel pedal positions to make a good power gain. This then avoids the need to have an additional Accel Pedal Tuning box.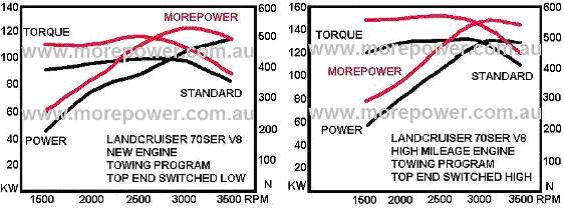
Many People do not understand the difference between Power & Torque, or what this can do for fuel economy.
We did back to back testing with two STANDARD vehicles on same drive covering 450km.
Merc R300CDI 140kw, 440Nm@1400rpm, ADR Av 9.3L/100km = Av on trip 8.5L/100km
BMW X5 30d 180kw, 540Nm@1750rpm, ADR Av 7.4L/100km = Av on trip 7.7L/100km
Both vehicles engines in top gear are 1500rpm@100kmh, at this speed the 140kw R300 feels more powerful than the 180kw X5, but only because the R300 is 100rpm inside it’s torque band, where the X5 is 250rpm below it’s torque band. This also explains the difference between the expected ADR average fuel economy figure & the real life figure achieved on the day.
Our current vehicles results on same road route of 450km.
Standard
Merc R350CDI 195kw, 620Nm@1600rpm, ADR Av 8.5L/100km = Av on trip 8.0L/100km
MorePower Tuned
Merc R350CDI 224kw 725Nm@1500rpm, ADR Av 8.5L/100km = Av on trip 7.4L/100km
Best individual trip for our R350 is 6.7L/100km & our Av for last 47,000km is 7.9L/100km
Both of our company vehicles have consistently demonstrated better Fuel Economy than their expected ADR figures, & we also achieved the same with our previous cars. We had a loan car from our Mercedes dealer when our B-class was being serviced, a 1.5ton 2012 Mercedes C200 petrol. We drove this car & our 2.3ton R-class on same trip, one behind the other, C200 did 8.3L/100km, our R350CDI did 7.7L/100km. The C200 ADR sticker on the windscreen said it should get 6.8L/100km & the R350CDI should get 8.5L/100km.
Buy a Morepower Tuning Box for my vehicle.
Find out more about: